집단유전학 통계 프로그램(Population genetics data analysis program) 입니다. 집단유전학 뿐 아니라 생물학 분야에서 다양하게 나타나는 실험 결과를 분석하고 검증하기 위해서는 통계학적인 분석이 필수적입니다. 통계분석 프로그램에는 다양한 종류가 있습니다. 지금 소개하는 이 프로그램은 STR(microsatellite), SNP(single-nucleotide polymorphism)와 같은 유전자 변이 정보를 이용한 검증 및 집단유전학적 분석을 수행할 수 있는 프로그램 입니다. 다른 것들에 비해 사용이 편리한 편입니다. 분석 가능한 자세한 목록은 아래에 있습니다.
Powermarker v3.25 (download) &
manual download
(
.Net framework 1.1 must installed)
Homepage =>>
http://statgen.ncsu.edu/powermarker/index.html
<가능한 분석 목록>
| Summary
statistics |
- Compute sample size
- Compute number of observation
- Compute allele number
- Compute availability (1 - missing proportion)
- Compute gene diversity using biased or unbiased
version
- Compute polymorphism information content
- Compute heterozygosity
- Compute stepwise mutation index which was defined as
the maximal proportion of alleles which follow stepwise mutation pattern
- Compute moment estimator or maximum likelihood
estimator of within-population inbreeding coefficient
- Summarize result at any level
- Bootstrap across loci to estimate confidence
intervals
- Estimate allele frequency and its variance
- Bootstrap across individual to estimate confidence
interval
- Estimate genotype frequency and allele
covariance
- Bootstrap across individual to estimate confidence
interval
- Estimate haplotype frequency using EM
algorithm
- Estimate haplotype frequency using BisectionEM
algorithm
- Estimate haplotype frequency using TrioEM
algorithm
- Assign haplotype probabilities for each
individual
- Test Hardy-Weinberg equilibrium by ChiSquare
test
- Test Hardy-Weinberg equilibrium by likelihood ratio
test
- Test Hardy-Weinberg equilibrium by Exact test
- Compute Hardy-Weinberg disequilibrium
statistics
- Bootstrap across individual to estimate confidence
interval for Hardy-Weinberg disequilibrium statistics
- Estimate linkage disequilibrium D
- Estimate D'
- Estimate RSquare
- Estimate population attributable risk
- Estimate proportional difference
- Estimate Yule's Q
- Estimate two-loci haplotype frequency for computing
LD statistics
- Test two-loci linkage equilibrium by ChiSquare
test
- Test two-loci linkage equilibrium by Exact
test
- Test multi-loci linkage equilibrium by Exact
test
- Prepare 2D matrix for 2D plot
|
| Population
structure |
- Estimate population structure with admixture
- Estimate population structure without
admixture
- Estimate classic coancestry matrix
- Estimate population specific coancestry
matrix
- Estimate classic two-level F-statistics assuming
Hardy-Weinberg equilibrium
- Estimate classic two-level F-statistics considering
inbreeding
- Estimate classic three-level F-statistics assuming
Hardy-Weinberg equilibrium
- Estimate classic three-level F-statistics
considering inbreeding
- Estimate population specific two-level F-statistics
assuming Hardy-Weinberg equilibrium
- Estimate population specific two-level F-statistics
considering inbreeding
- Bootstrap across loci to estimate confidence
interval
|
| Phylogenetic analysis |
- Estimate frequency from DataSet
- Estimate distance based Frequency data using 19
different methods
- Construct UPGMA tree
- Construct NJ tree
- Bootstrap across loci to construct multiple trees
for tree consensus
|
| Association study |
- Allele test
- Genotype test
- Trend test
- Distance test
- Exact test
- Genotype based F-test
- Haplotype trend regression for binary and
quantitative traits
|
| Design |
- Choose core set of lines by allele number, allelic
diversity, allelic entropy. Selection can be done with simulated annealing,
random search or exhaustive search under general constrains
- Choose haplotype tagging markers from haplotype
data
- Choose haplotype tagging markers from genotype
data
- Choose haplotype tagging markers from trio
data
|
| Tools |
- Mantel test
- Contigency table analysis
- SNP identification from sequences
- Parse Structure's result
- SNP simulation under coalescence model
- SNP simulation under coalescence model with
recombination hotspots
|
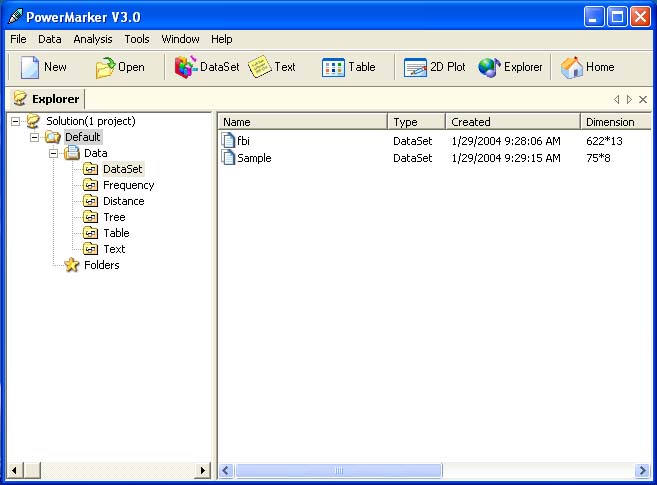
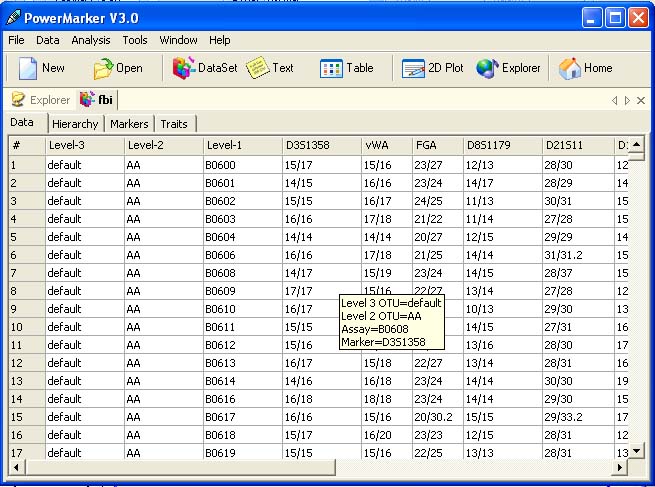
<ScreenShots>